NLT HF-Stock Trading
High Frequency Trading dominates the worldwide stock markets. Request a PDF copy for higher resolution!
Read off the chart what is going on and take advantage of it: Trade What You See !
Find high probable trade proposals right on the chart.
- Trade short-term: 1-5 days. Strive for stock returns >3% or option returns above 30%.
- Trade long-term: 1-5 weeks. Strive for stock returns >10% and option returns above 50%.
- Find clearly defined entries, exits and stop levels in our NLT-HF-Opportunity-Reports, which we send to you at least 3 times per week, or right on the chart.
- Make money when the markets move up or down with all account types.
Step up your trading by seeing on the chart what is going on and how you can benefit from this knowledge.
- You will no more be dependent on “expert” recommendations, personal or fundamental assumptions.
- In no way will your trading depend on European developments, the election, or the economic outlooks.
- Our reports, studies and Indicators spell out highly probable trade proposals right on the chart.
We are happy to give you a private, personal, interactive introduction to the “Never Loss Trading High Frequency Stock Trading Mentorship”: contact@NeverLossTrading.com, which will reveal everything from...
Why some of the most successful investors in our community are so eager to use "Never Loss Trading"... to how you can beat the best hedge fund managers of the world -- no matter what the market does... to how to protect a position if the trade runs against us, turning potential losers into winners.
Please continue reading to experience the details and opportunities the NLT High Frequency Stock Trading Mentorship can provide for you.
Never Loss Trading
P.S. Because this opportunity is supposed to be reserved solely for a selected group of investors, we kindly ask that you not forward this e-mail.
1 Introduction to NLT HF-Trading
Daily, stock traders are confronted to choose from about 40,000 different shares to trade.
Institutional investments dominate more than 85% of the overall stock markets. High frequency or algorithm trading, sector rotation with Investments or disinvestments dominate the overall markets.
How to identify sector rotation and stocks with institutional attention?
Which are the stocks with highest returns and least investment risks?
The “NLT High Frequency Stock Trading Program” works as a standalone concept and supplements other NLT-programs, helping you to find the answers to the questions above, by providing leading guidelines for sound investment decisions.
“Trading is complicated, if you trade what you think,
it is not when you trade what you see: Never Loss Trading paints it on the chart”.
 |
The NLT HF-Indicator (High Frequency Trading) identifies institutional price moves early and on all time periods. |
Confidentiality Notice: The information contained in this message may be confidential or privileged and exempt from disclosure under applicable law. If the reader of this message is not the intended recipient, an employee or agent responsible for delivering this message to the intended recipient, you are hereby notified that any disclosure, dissemination, distribution or copying of this communication is strictly prohibited. If you received this communication in error, please immediately notify the sender of your inadvertent receipt and delete this message from all data systems.
Disclaimer: All our publications are designed to provide accurate and authoritative information in regard to the subject matter covered and shared with the understanding that the publisher is not engaged in rendering legal, financial advice, accounting, or other professional service. If legal advice or other expert assistance is required, the services of a competent professional person should be sought. We advise all readers that it should not be assumed that present or future performance would be profitable or equal the performance of our examples. The reader should recognize that the risk of trading securities, stocks, options, futures can be substantial. Customers must consider all relevant risk factors, including their own personal financial situation before trading. In our teaching of NeverLossTrading, in our books, newsletters, webinars and our involvement in the Investment Clubs, neither NOBEL Living, LLC, the parent company of Never Loss Trading, nor any of the speakers, staff or members act as stockbrokers, broker dealers, or registered investment advisers. We worked out trading concepts that benefit us greatly and share them through education with our readers, members and clients.
With NLT High-Frequency-Trading, we participate in the constant changes of the markets by receiving frequent trade signals to the up- or downside to trade them on a weekly or daily basis.
Our proposed trade-entry is about 2 ticks above or below the spelled--out entry price.
The NLT HF Stock Trading Program Covers:
Option trading at times is considered high-risk. Not with the NLT-Delta-Force-Method.
We are trading with limited risk for high returns on high probability trade entries only.
Our trade entries identify institutional engagement into a share, which we synthesize by changes in: Price, volume, volatility.
We use algorithmic adaptation models to spell-out proposed trade-entries and only enter a trade, when the spelled-out price threshold is surpassed.
1.1 Short-Term Trading
Which industry-sectors are on the move?
Besides teaching you how to trade with NLT-Strategies, you will receive multiple reports per week, where we communicate directional opportunities of NLT-selected industry sectors:
The list of shares fulfilling NLT-HF-Requirements is constantly monitored and adjusted.
When you are signing up for our NLT HF-Trading Mentorship, the first three-months of our reports is included. If you want to receive our reports after, a quarterly fee of $477 will be charged.
Besides the sector and share development report, you will receive a daily top-down sector analysis:
Column |
Explanation |
S&P 500 and Sector Development |
Splits the S&P 500 into major industrial sectors. |
Sector Share |
Share of the total S&P 500. |
Move Close to Close |
Daily price development in percent. |
Net Change Direction |
Increased prices: Up. Decreasing prices: Down. |
Move to SPU |
Actual price development in relation to the expected daily price move: SPU (Speed Unit). A measure of 40% expresses that the price move of the observed segment was 40% of the expected price move for the day. |
Move to Market |
Relates the sector move to the overall market move and marks with attention, sectors which had a bigger than overall market move. In the example above, each sector is highlighted. The overall market basically had no move as result of some sectors moving slightly up and others slightly down. |
Underlying Indication |
This measure is based on the last hours of the trading day, indicating a potential tendency for the next day opening of the market. |
Daily TradoMeter |
Here we measure changes in market momentum. New Up or New Down identifies a change in momentum. Up or down a continuation of the momentum. |
Daily CommandoGraph |
Measuring the trend of the market and sector. New Up or New Down signifies a change in the trend, while up or down indicates the stage of the trend. |
Light Tower Candle |
When a significant price move happens, this gets indicated by a light tower candle. |
Purple Zone |
The NLT-Purple-Zone-Indicator measures price consolidation zones, which usually happen prior to a price move. These zones are characterized by opposite price moves and we mostly trade when the end of the zone is indicated, and do not trade while it is indicated. |
Daily Volume |
A measurement for a change in volume, identifying institutional involvement. |
Daily Volatility |
Price change goes hand in hand with a change in volatility, which we measure here. |
How to Read the NLT Sector Analysis
- Overall strong market, indicating to rather hold long than short positions.
- The tendency for the overnight session and potential opening is to the downside.
- Strongest Sector: Consumer-Discretionary.
- Utilities have a weak momentum and Material stocks showed first weakness, while the overall trend is still to the upside. Hence, the indicated weakness could be a retracement.
1.2 How to Identify Short -Term Stock Trading Opportunities
How to trade, capture, and leverage identified opportunities to the up- and downside from each type of account, even so shorting stocks cannot be done from cash accounts like IRA-, Custodian, and Margin-Accounts with holdings below $25,000.
We did the work for you and identified set of about 100 shares, allowing for:
Strong, predictable directional share price moves, with a minimum return on investment above 3%, in two to five trading-days, when trading the shares and above 30% when trading options:
Captured Share Price Move/(Capital-Invested)> 3% in 2 – 5 days.
Trade entries and exits are based on the “NLT High Frequency Indicator”, which portraits high probable trading opportunities right on the chart (dark-green signals).
Our list of shares, which qualify for NLT HF-Trading, is constantly monitored and updated. Currently, we report on a set of 89 shares from various industry sectors. In addition, we observe and report on 13 high yield stocks. In total, we constantly keep you up-to-date on more than 100 stocks, highlighting those ready to be traded by the NLT-HF-Indicator.
NLT HF-Opportunity-Report (please magnify)
The last column of the report shows the status. In the above report, we are just two days into the trade. Three orders were filled on August 13, two did not reach the required price threshold and we passed on the trade.
This report allows for automatic trading, where the entry- and exit level prices can be defined as well as the stop level.
Besides using a hard stop, we will also train you to find methods of protection that will potentially turn losers into winners.
At times, we get asked how our selected set of stocks compares to the S&P 500.
Comparison of the NLT HF-Stocks-List to the S&P 500
The S&P 500 is built based on the market capitalization of biggest 500 US companies:
Share Value x Shares Emitted = Market Capitalization
Industry Sectors of the S&P 500
When taking a small sample of shares from the biggest sectors: Technology and Consumer to check the share price development of the top three companies, none qualifies for NLT-HF-Trading, while we consider them in other NLT-Trading Plans.
Sector |
Selected Company |
NLT Trading Plan Consideration |
|||
|
|
Top Line |
Wealth Building |
Income Generating |
HF-Trading |
Technology |
Apple Computer |
x |
x |
x |
|
Consumer |
Procter and Gamble |
x
|
x x |
|
|
By focusing on a different set of stocks, HF-Trading is treated and taught as a separate concept:
- NLT-HF-Trading requires specific share price developments to fulfill the set return requirements.
- The concept is based on a specific set of indicators, which support High-Frequency-Trading.
- Even so, NLT-HF-Stock-Trading has its own trading strategy and instruments, it follows the general principles of Never Loss Trading. The NLT-HF-Indicator works wonderful in conjunction with all other NLT-Indicators and concepts.
- Breakout: Defines a situation where a price-breakout has a high potential to happen.
- Trend: After a breakout, the directional move of a share is defined as the short term trend and we trade along with it.
- Strong Up: Identifies an approaching price breakout when the high or low of the initiation candle gets surpassed in the price move that follows.
- Strong Down: Same condition as “Strong Up”, just in the opposite direction.
- Dark-Green Trade Entry Proposals for 1-SPU.
- Pink Trade Entry Proposals for 2-SPU’s.
- Trade Target: Entry + 1-SPU, or the next NLT Price-Gravitation-Line.
- Stop: 1-SPU, maximum 2-SPU .
- Time in the Trade: Expected exit after three time-units/bars, while we
-
If we receive an NLT-HF-Signal prior, and entered a trade already, then we can potentially widen our expected price target. In the example above, the “HF-Signal” was triggered on the bar prior to the “Pink-Signal”; with that we were able to widen the price target to 1-SPU from Entry of the “Pink-Signal”.
-
After a “Pink Signal”, the share price move has to surpass a critical support/resistance level indicated by a NLT-Box-Line.
- We differentiate trades in direction and opposite to the NLT-Trend-Channel.
- Target in the Direction of the NLT-Trend-Channel
By our research, we recognized: When a “Pink-Signal” announces a price reversal in direction of the NLT-Trend-Channel, that prices accumulate, revert or retraced at the following price specific points:
- After 1-SPU move.
- At the mid line of the price channel.
- At the top/bottom line of the price channel
- After a price move of 2 x SPU
- On a big price move, after 3 x SPU
Knowing this, we can use those price points to either take profits trail our stops with either the NLT-Box-Line or the NLT-Double-Decker-Line.
The initial stop is taken below the NLT-Double-Decker or Box-Line.
Target Opposite to the NLT-Trend-Channel
The “Pink” price indication results off the NLT-Top and Bottom Finder.
Our “Top and Bottom Finder” is programmed to announce when highs are high and lows are low, with a tendency to reverse.
The Price-Target is of the NLT-Top-and-Bottom-Finder is defined by the last Support/Resistance line drawn on the chart from the NLT-Box-Indicator.
The stop for the trade is ½ SPU above the high/low of the entry price level or two ticks above the last-prone NLT-Box-Support/Resistance drawn on the chart.
Next we check how the trade proposals from the prior list turned out:Indicated Trades from August 13
JNPR came to profit on the same day we entered into the post ion.
MGM: Our target-price was reached on the third day.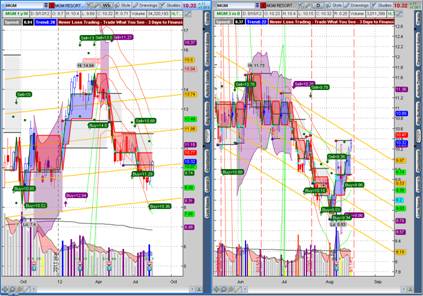
MU: The price moved back to entry and we are still in the trade.
We even received an opposite facing Buy signal and have to decide:
- Stay in the position.
- Leave the position.
- Adjust the trade with a protection measure.
We decided to stay in the trade and only exit when the red Double-Decker Line is surpassed.
The next chart will show that our position got challenged, but the red line never surpassed and we exited at our target price.
MU: Continuation
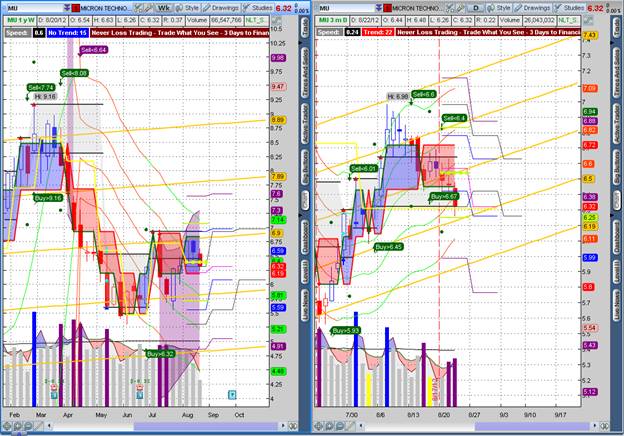
On 8/22, our target-price was reached and we exited the trade.
Summary
The August 13, HF-Opportunity Report gave us three shares to trade, which all turned into winners:
SymbolDirection
Entry Date
Exit Date
Return (Cash)
Return on Margin
JNPR
Downside
Aug. 13, 2012
Aug. 13, 2012
3.0% (1 day)
6% (1 day)
MGM
Upside
Aug. 13, 2012
Aug. 16, 2012
3.5% (3 days)
7% (3 days)
MU
Downside
Aug. 13, 2012
Aug. 22, 2012
2.3% (9 days)
4.6% (9 days)
When we sum up the three trade examples above:
- Average days in the trade: 4.3
- Average return (assuming equal investments): 3% on cash, 6% on margin
If we would continuously produce a 3% return on 4.3 out 360 days, it will mean:
- 240% return in one year without compounding interest, on an average 3% return per trade.
1.2 How to Identify and Trade Longer-Term Opportunities
We specify longer term opportunities for trades with an expected time in the trade of 1-5 weeks.
Those opportunities are either captured by trading the stock or the options.
Trade Signals are taken from weekly charts and executed on daily price breakouts above the pre-defined threshold:
The setting of target prices, stops and trailing stops follows the same principle as spelled out in the short-term example.
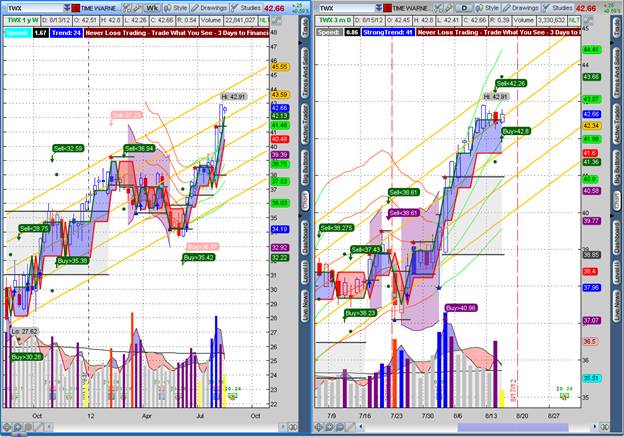
TWX Example- Entry at $35.43, 1-Tick above the spelled out entry price.
- First Target: 1-SPU; $1.67 + 35.42 = $37.09 (expected return: 4.7%)
- Pink Signal on the second, in direction of the channel:
New Target: $36.47 + 2-SPU = $36.47 + $3.34 = $39.81 (expected return: 12.4%)
Had we traded the same price move by applying the NLT-Delta-Force method for long term trading, the achieved results would look as follows:- Option-Trade-1 (38 days to expiration).
- Option-Trade-2 (128 days to expiration).
Both option alternatives are not our preferred choice, but the only available trading alternatives fitting the NLT-Delta-Force concept. Next, we compare the return on investment on equal spending:
Trading AlternativesPremium
Contracts
Investment
Profit 6/18
ROC
Profit 7/3
ROC
Option-Trade-1
$ 0.69
18
$ 1,242
$ 1,755
141%
$4,059
327%
Option-Trade-2
$ 1.23
10
$ 1,230
$ 785
64%
$1,650
134%
To relate the option trade with the stock trade, we are comparing the maximum risk of the option trade: The premium paid: %1,242, with the risk of a 1-SPU-Stop, trading the stock.
TWX: 1-SPU = $1.67/week. Accepting a maximum risk of $1,242, allows to trade 743 TWX shares: $35.43/share x 743-TWX-shares = $26,339.25 (investment).- 1-SPU Target : 1.67 x 743 =$1,240 (ROC 4.7%).
- 2-SPU Target: 3.34 x 743 = $2,481 (ROC 12.4%).
The prior and following charts show, how frequent the NLT-HF-Concept provides trade opportunities, and we continuously report on those. Surely the choice is yours: How often you want to trade and which securities you pick.
At each opportunity the trade entry and target will be painted on the screen.NLT HF-Stock Package for New Students
NLT HF-Stock Package for former Students
Software Packages for new Students
Software Packages for former Students
NLT-HF Indicator: Price entry and exit proposal
NLT Top and Bottom Finder
NLT_Speedometer_Box
Already received
NLT_Purple_Zone_Indicator
Already received
NLT_Candle_Color
Already received
NLT_Wave
Already received
NLT_Box
Already received
NLT_Double_Decker
Already received
NLT_Light_Tower_Candle
Already received
NLT_Price_Volume_Study
Already received
NLT_Price_Gravitation_Lines_Daily_Trading
Already received
NLT_Price_Gravitation_Lines_Weekly_Trading
NLT_HF-Trading-Plan_and_Tutorial
Mentorship
Three, eight-hour classes.
For 3-Months, we provide at minimum three NLT HF-Opportunity-Reports per week.- Weekly opportunities
- Daily opportunities
Three months aftercare, once a month, 2 hours of training and support.
Mentorship
Two, eight-hour classes.
For 3-Months, we provide at minimum three NLT HF-Opportunity-Reports per week.- Weekly opportunities
- Daily opportunities
Three months aftercare, once a month, 2 hours of training and support.
Documentation's
NLT-High-Frequency-Trading-Write-Up and NLT-Tutorial.
Trading Plans for NLT-HF-Trade-Situations.
The NLT-HF-Trading, complements the other Never Loss Trading programs and does not substitute or replace them.
The lower studies used in the “NLT Top-Line Program”, “Wealth Building”, “Income Generating”, and the referring trading plans are not part of the “NLT HF-Package”. They are taught and provided in the individual mentorship programs.- “Top-Line”,
- “Wealth Building”,
- “Income Generation”,
NLT-HF-Indicators are not included in the other NLT-Mentorship programs.
Trade proposals of the NLT HF-Indicators partially overlap with indicator readings used in the other NLT-concepts, while the NLT HF-Concept provides additional and more specific high frequency trade proposals.The HF-program works with all securities, while our reports focus on a selected set of shares, which provide strong directional moves and high returns on a daily and weekly basis.
Our examples show that we take trades to the up and downside. Cash-based accounts like IRA or custodian accounts and margin accounts with holdings below $25,000, do not allow for shorting stocks. This shall not be your concern; we will show you methods to trade to the downside that are totally compliant and applicable to every type of account. You will even learn how to leverage and protect your 401(k) investments.
Our indicators point out strong directional moves. However, what to do if a trade goes against you: Capital preservation is important. As part of our mentorship, we will dedicate ourselves to train you on methods of how to turn potential losers into winners.
Make an appointment ! contact@NeverLossTrading.com
and you will see how NLT HF-Trading works and what it can do for you.
We take pride in your success,Never Loss Trading

Sign our VIP introduction:
Click here....
Mentorship's Overview
.png)
Trade a set basket of securities and their options: High leverage, limited risk. Operate your own opportunity scanner.
Click here for more details….
Following our buy and sell strategy, we trade on high frequency price changes. Take your trades from our reports or right from you charts.
Click here for more details…..png)
Learn how to trade of a selected basket of stocks and their options. Protect and leverage your investments. Focus on constant monthly and weekly returns.
Click here for more details…..png)
Learn how to day trade Futures and Options. A class in particular liked by people who want to make daily income with trading. A new and highly valuable trading concept, even for the advanced market investor. Click here ...

Learn how to day trade Stock and their Options, Index-, Commodity-, Treasury-, Currency-Futures and FOREX Pairs. A class for day traders who are serious about making money from the financial markets. Click here ...

After you participated one of our mentorship programs, we offer you to join our communication network as a member, with online investment discussion forums, newsletters, webinars, education.
Click here for more details…..png)
Find a write up about NeverLossTrading, our concept, indicators and the different education programs we offer by clicking here…. or schedule a introduction with us: contact@NeverLossTrading.com
How to experience or join
 ?
?Sign our VIP introduction:
Click here....

Annual Subscription! Participate in our webinars where we will discuss the different trading strategies for the upcoming week.

Learn to be a Successful Financial Market Investor! Treat trading as a business: prepare your mind, set you own goals, execute NeverLossTrading, attain set returns, reach your financial goals.
Disclaimer
The risk of trading securities, options, futures can be substantial. Customers must consider all relevant risk factors, including their own personal financial situation before trading. In our teaching of how to trade the markets, in our newsletters, webinars and our involvement in the Investment Clubs, neither NOBEL Living, LLC, the parent company of Never Loss Trading, or any of the speakers, staff or members act as stockbrokers, broker dealers, or registered investment advisers. We worked out trading concepts that benefit us greatly and share them through education with our members and clients.
 The Never Loss Trading Concept
More Info
 Never Loss Trading Club Constitution
More Info
 Questions and Answers: More Info
  Events: More Info
In addition to the indicators you see on the chart, we also report on short-term price changes and identify potential short-term price moves, for us to trade along with, identifying three different trade indications where we trade for ½ SPU or 1-SPU when we get confirmation by same direction facing dark-green or pink signal on the screen:
The signs above are part of the NLT HF-Opportunity report as additional readings besides the powerful signals we focus on with the NLT HF-Concept:
To get a good reading of the overall price direction of a share, we put a weekly and the daily chart side by side and trade when the entry price level is surpassed, and exit where our software puts a dark-green dot on the chart.
NLT High-Frequency-Targets: “Dark-Green” and “Purple” Price Indication on the Chart

Green and Purple Targets:
The NLT-HF-Target-Price-Level is painted on the chart by a dark-green dot, while it is important to consider Price-Gravitation- and Support/Resistance-Lines.
Red NLT Double-Decker-Line on same directional trades.
Green NLT Double-Decker line at opposite facing trades.
Gray NLT Box-Line.
Above the prior high/low of the trade initiating candle.
recommend a cycle count based adding up the candles per NLT-Double-Decker-Section until the next color change of this indicator.
Targets for “Pink” Price Indications
“Pink-Signals” are not made to stay on the chart like the “Dark-Green-Signals”, they are an early indicator in relation to the overall NLT-Channel-Trend and require confirmation:
 US Stock Market Holiday Schedule: